
A low cost per lead sounds like a win. It rarely tells the whole story. Cost per lead, commonly abbreviated as CPL, is one of the most widely tracked metrics in digital marketing. Yet it is also one of the most frequently misunderstood. Knowing what is cost per lead and how to calculate it correctly can mean the difference between scaling a profitable campaign and pouring budget into leads that never close. This guide covers the full picture: the formula, the nuances, channel differences, industry benchmarks, and how to use CPL to actually improve your results.
What is cost per lead and how to calculate it
The cost per lead formula is straightforward: divide your total marketing spend by the number of leads generated. If you spent $600 on a campaign and generated 100 leads, your CPL is $6. Clean, simple, and dangerously incomplete if you stop there.
The problem is in what most marketers count as “marketing spend.” Many teams only pull their ad spend from the platform report and call it done. That number ignores the software subscriptions, content production, creative design, agency fees, and allocated staff time that make those ads run. Fully-loaded marketing costs should include all of those line items. Omitting them can underreport your true CPL by 30 to 60 percent, which means every decision you make based on that number is built on a flawed foundation.
Here is a practical example. Say your Google Ads campaign spent $2,000 last month. But you also paid $300 for landing page software, $400 for a copywriter, and your in-house coordinator spent roughly 10 hours managing the campaign at $50 per hour. Your fully-loaded spend is $3,200, not $2,000. If the campaign generated 80 leads, your real CPL is $40, not $25.

Pro Tip: Always define what qualifies as a lead before you run any report. A raw form fill is not the same as a marketing-qualified lead (MQL). If your CPL calculation mixes unvetted form submissions with genuinely interested prospects, you are comparing different things across different months.
The most common calculation pitfalls include:
- Counting only paid ad spend and ignoring all other campaign costs
- Mixing raw form fills with MQLs in the same lead count
- Failing to allocate shared software or salary costs to specific channels
- Comparing CPL across campaigns that defined leads differently
- Pulling data from the ad platform rather than a CRM with full attribution
Consistent definitions and fully-loaded cost accounting are the only way to make CPL a trustworthy number.
How CPL fits with other funnel metrics
Cost per lead does not exist in isolation. It sits at one specific stage of the marketing and sales funnel, and understanding where it fits helps you see what it can and cannot tell you.
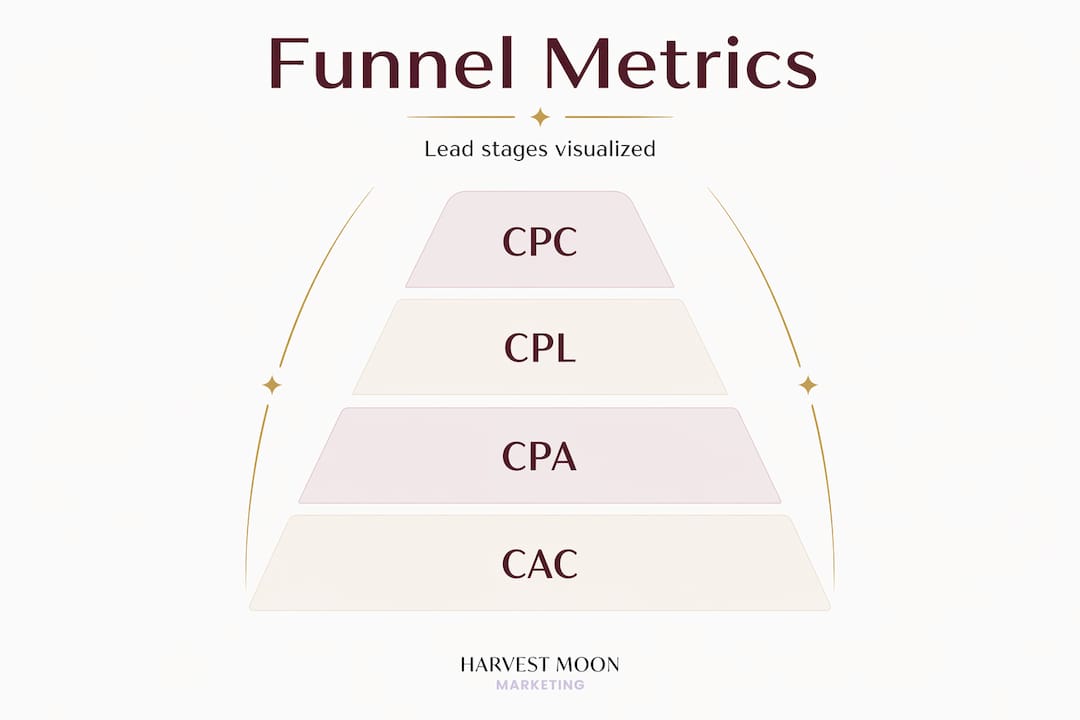
Here is how the four core metrics map to the funnel:
| Metric | What it measures | Funnel stage | Best used for |
|---|---|---|---|
| CPC (cost per click) | Cost of one website visit | Top of funnel | Evaluating traffic efficiency |
| CPL (cost per lead) | Cost of one new lead | Middle of funnel | Measuring lead generation cost |
| CPA (cost per acquisition) | Cost of one conversion | Lower funnel | Assessing campaign profitability |
| CAC (customer acquisition cost) | Total cost to acquire one customer | Full funnel | Evaluating overall marketing ROI |
Each metric answers a different question. CPC, CPL, CPA, and CAC each represent a distinct stage: traffic, lead, conversion, and customer respectively. Tracking only CPL tells you whether your lead generation is efficient but says nothing about whether those leads are turning into revenue.
The real value comes from tracking all four together. A campaign with a great CPL but a poor CPA signals that leads are not converting. A high CAC relative to customer lifetime value tells you the whole acquisition model may be unsustainable, regardless of how attractive the CPL looks on a dashboard.
When you see these metrics side by side, patterns emerge that no single number can reveal on its own.
What affects cost per lead and how to interpret it
CPL varies enormously across industries, channels, and business types. Before you judge your numbers, you need the right frame of reference.
Industry benchmarks in 2026 show order-of-magnitude differences in average CPL depending on the sector:
| Industry | Average CPL (2026) |
|---|---|
| E-commerce | ~$91 |
| Software / SaaS | ~$200 |
| Financial services | ~$270 |
| Healthcare | ~$360 |
| Higher education | ~$982 |
| Overall average | ~$214 |
A $150 CPL for a software company is reasonable. The same number for a local plumber would be a serious red flag. The acceptable CPL range is tied directly to how much a closed customer is worth to your business. A higher-education institution can justify spending nearly $1,000 per lead because a single enrolled student generates tens of thousands in revenue.
This is where the quality question becomes critical. A $20 CPL with a 1% close rate is a worse outcome than a $120 CPL with a 14% close rate. The math on cost per closed customer makes that obvious, yet marketers still chase the lower CPL because it looks better in a weekly report.
Pro Tip: Track CPL by channel, not just as a blended average. Your Google Ads campaigns, organic search, and email nurture efforts each have different CPLs and different lead quality profiles. Per-channel CPL reporting shows you where quality leads actually come from, so you can allocate budget with confidence rather than guessing.
Seasonality adds another layer of complexity. Costs fluctuate with time of year and platform due to competition, audience behaviour, and ad auction dynamics. A CPL spike in November does not automatically mean your campaigns degraded. Context always matters.
Using CPL metrics to improve your lead generation ROI
Knowing your CPL is only useful if you act on it. Here is how to turn this metric from a reporting number into a decision-making tool.
Connect CPL to downstream revenue. Closed-loop analytics that link CPL with revenue data give you a far more accurate picture of marketing ROI. If you know that leads from a specific campaign close at twice the rate of your average, that campaign deserves more budget even if its CPL is higher.
Break down CPL by channel. A blended CPL across all channels hides where your budget is actually working. When you separate Google Ads, organic search, and email marketing, you can see which channel delivers the best combination of volume, quality, and cost. This is where real budget optimisation happens. A Harvestmoonmktg PPC case study illustrates exactly how per-channel tracking led to significantly lower lead generation costs during peak season for one service business.
Use fully-loaded CPL for every decision. Never present only ad spend as the basis for CPL to stakeholders. Even sophisticated marketers undercount total spend and end up with a vanity number that flatters reports but misleads resource allocation.
Pair CPL with lead quality scores. Set up a lead scoring system in your CRM so that each lead generated carries a quality indicator. When you review CPL by channel, layer in average lead score to see whether lower-cost channels are actually sending you leads worth pursuing.
Avoid over-optimising for low CPL alone. Optimising CPL in isolation risks filling your pipeline with unqualified prospects who waste your sales team’s time. The goal is profitable leads, not just cheap ones.
The smartest marketers treat CPL as one signal in a broader measurement system. It is the entry point to a fuller conversation about marketing efficiency and revenue impact.
Common mistakes that distort your CPL
Getting CPL wrong is surprisingly easy. These are the mistakes that show up most often, even in experienced marketing teams.
-
Counting only ad spend. Omitting content, software, agency fees, and salaries creates a vanity CPL number that flatters your reports and misleads every decision downstream.
-
Mixing lead definitions. Comparing a month where you counted raw form fills with a month where you counted only MQLs is an invalid comparison. Consistent lead qualification criteria are non-negotiable for meaningful CPL tracking.
-
Ignoring lead quality. A low CPL accompanied by a low close rate is not a win. Always check what happens to leads after they enter your pipeline before drawing conclusions about campaign performance.
-
Relying on blended CPL. A single blended number across all channels tells you almost nothing useful. It can mask a high-cost, low-quality channel dragging down your overall performance while hiding your best-performing source.
-
Missing seasonal context. A CPL that rises in Q4 may reflect competitive ad auctions, not failing campaigns. Always benchmark against the same period in prior years before making reactive budget cuts.
Each of these mistakes is fixable once you know what to look for.
My honest take on CPL measurement
I have worked with enough businesses to know that CPL is the metric people trust most and measure worst. The number looks definitive. It feels like it tells you something. And in a lot of cases, it is quietly hiding the real story.
What I have found repeatedly is that the clients who struggle most are the ones obsessing over getting CPL down. They cut budgets on channels generating higher-cost but high-quality leads and funnel money toward cheap leads that never close. The sales team gets frustrated, pipeline quality drops, and nobody can figure out why revenue is not moving. The CPL looked great.
My experience is that the fix is not complicated, but it requires discipline. You need to count all your costs. You need a single, agreed-upon definition of what a lead actually is. And you need to connect your CPL data to what happens in the CRM after the lead comes in. When those three things are in place, CPL becomes genuinely useful. Without them, it is noise dressed up as measurement.
The businesses I have seen grow consistently treat CPL as a starting point, never a destination. They pair it with conversion rates, customer value, and channel-level reporting. That combination tells you where to invest and where to stop. That is what real marketing ROI looks like.
— Harvest
How Harvestmoonmktg can improve your lead generation costs
Understanding CPL theory is one thing. Building campaigns that actually deliver quality leads at a profitable cost is where most businesses need a partner. At Harvestmoonmktg, we work with service-based businesses across Canada to do exactly that.
PPC lead generation through Google Ads is our most direct channel for driving measurable leads with full CPL visibility. We track fully-loaded costs, not just ad spend, so your reporting reflects reality. For businesses with an existing customer base, email marketing is a cost-effective way to stay top of mind and generate repeat enquiries at a fraction of the CPL you would see in paid search. For local businesses, organic search builds a sustainable lead pipeline that lowers your average CPL over time.
If you want a real conversation about your current CPL and where the gaps are, get in touch with Harvestmoonmktg. We will show you what is actually driving your lead generation costs and where to focus.
FAQ
What is the cost per lead formula?
CPL equals total marketing spend divided by number of leads generated. For an accurate result, total marketing spend should include ad spend, software, content, agency fees, and allocated staff time.
What is a good cost per lead?
A good CPL depends entirely on your industry and customer lifetime value. Industry averages in 2026 range from roughly $91 in e-commerce to nearly $1,000 in higher education, so benchmark against your sector, not a generic number.
Why is a low CPL not always a good thing?
A low CPL only reflects lead volume at a given cost. If those leads have a poor close rate, your cost per customer will be high. A $20 CPL with a 1% close rate produces worse economics than a $120 CPL with a 14% close rate.
How often should I review my CPL?
Review CPL monthly at a channel level and quarterly against fully-loaded costs. Monthly reporting catches performance shifts early; quarterly reviews give you enough data to make reliable budget decisions without overreacting to short-term fluctuations.
What is the difference between CPL and CAC?
CPL measures the cost to generate a lead at the middle of the funnel. CAC (customer acquisition cost) measures the total cost to acquire a paying customer, incorporating conversion rates from lead through to closed sale.


